Science & Engineering · Public research article
Energy in motion for a more resilient grid
What a vacuum flywheel can offer, and how to prove its value
Imagine a heavy wheel that acts like a rechargeable reserve. Electricity spins it faster. Later, the wheel slows down and the same machine returns some of that energy as electricity. This could help smooth short interruptions in solar generation or sudden changes in demand.
The idea in one minute
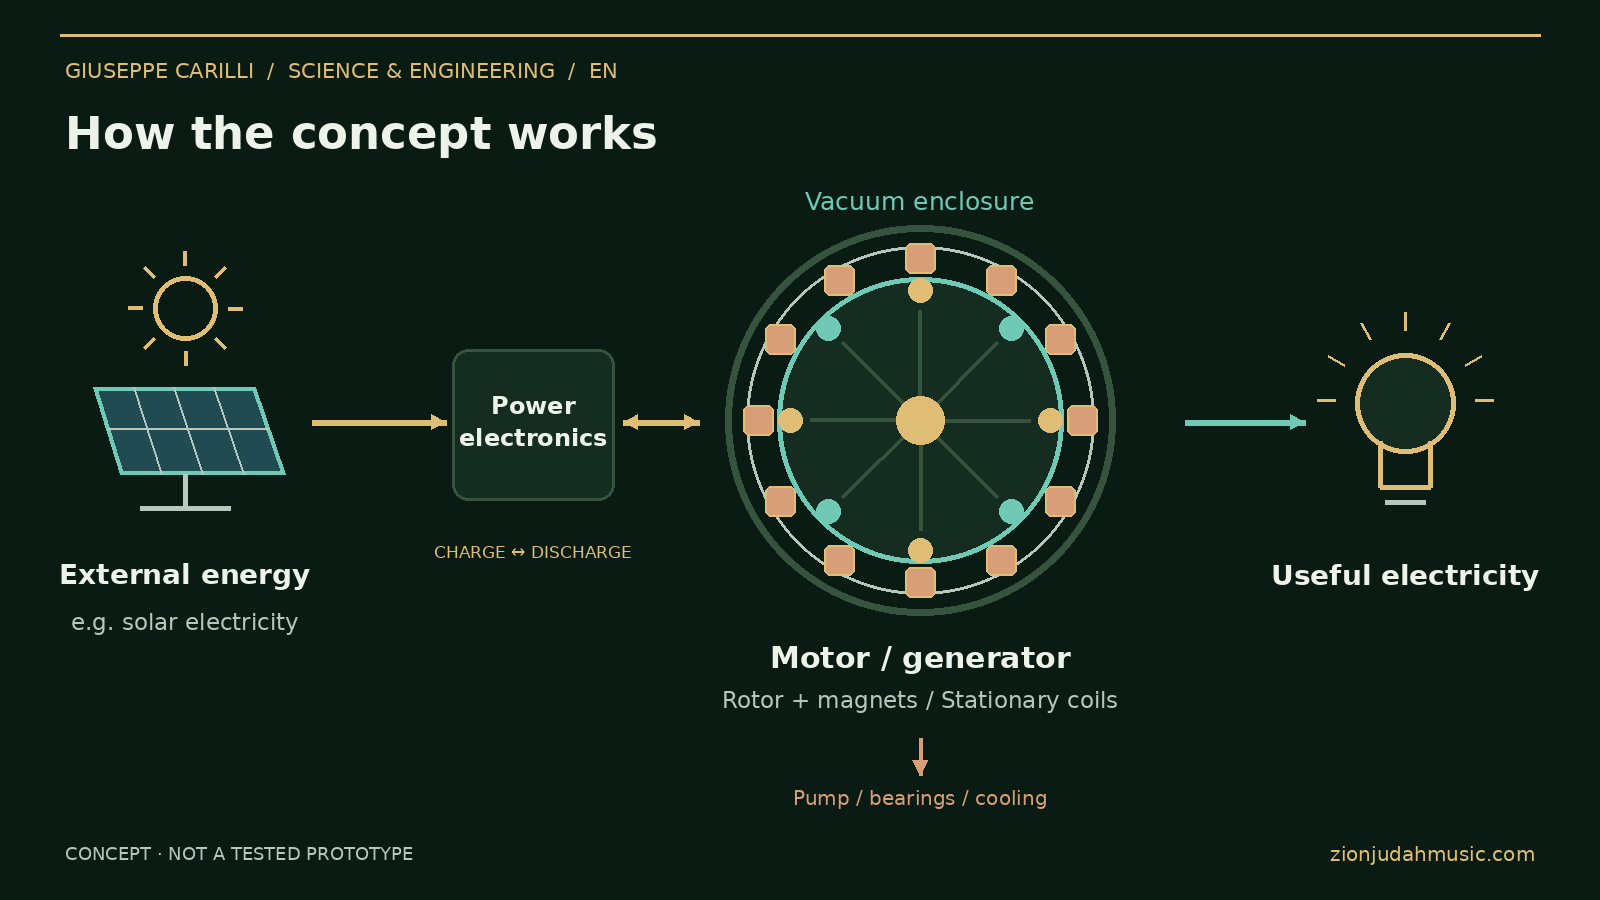
- The energy comes from outside: for example, a solar plant or another mechanical source.
- The rotor stores energy as motion. Magnets help convert energy; they are not a fuel.
- Vacuum may reduce air drag. Its pump, cooling, bearings and controls still use energy.
- The goal is useful, affordable storage. The paper proposes a design and tests; performance and long-term cost remain to be measured.
Watch the short illustrated explainer
Captioned conceptual animation with an original Organic Jazz-Zen instrumental background. It shows energy storage and conversion, not a working prototype or measured performance. No voice narration.
How the generator works, step by step
The proposed permanent-magnet machine can convert externally supplied shaft power into electricity. With a suitable bidirectional drive and rotor design, it can also operate as part of a flywheel storage system. These are two operating modes with different energy boundaries.
1. Follow the energy
An external motor or turbine turns a rotor carrying NdFeB magnets. The changing magnetic field induces voltage in fixed copper stator windings on a laminated electrical-steel core. In Faraday’s law, λ is the flux linkage of the winding. Drawing current produces opposing electromagnetic torque. At steady speed, the external drive supplies useful electrical output and all losses.
Tshaft is shaft torque in N·m; ω is angular speed in rad/s. Magnets provide the field; the drive supplies the energy.
2. Control the electricity
Machine frequency follows the pole-pair count and rotor speed: p is pole pairs and n is rpm. Four poles at 1,500 rpm give 50 Hz before electronic conversion. A rectifier, DC link and inverter adapt the generated electricity to the load. Charging the flywheel requires a bidirectional motor drive; a passive rectifier alone cannot accelerate it electrically.
The converter, control system and connection requirements must be designed for the intended electrical service.
3. Store energy in motion
Charging speeds up the rotor; discharge slows it. J is rotational inertia, and ωmax and ωmin define the useful speed range. The expression below is the change in stored rotational energy. Delivered electrical energy is lower after conversion, waiting and auxiliary losses.
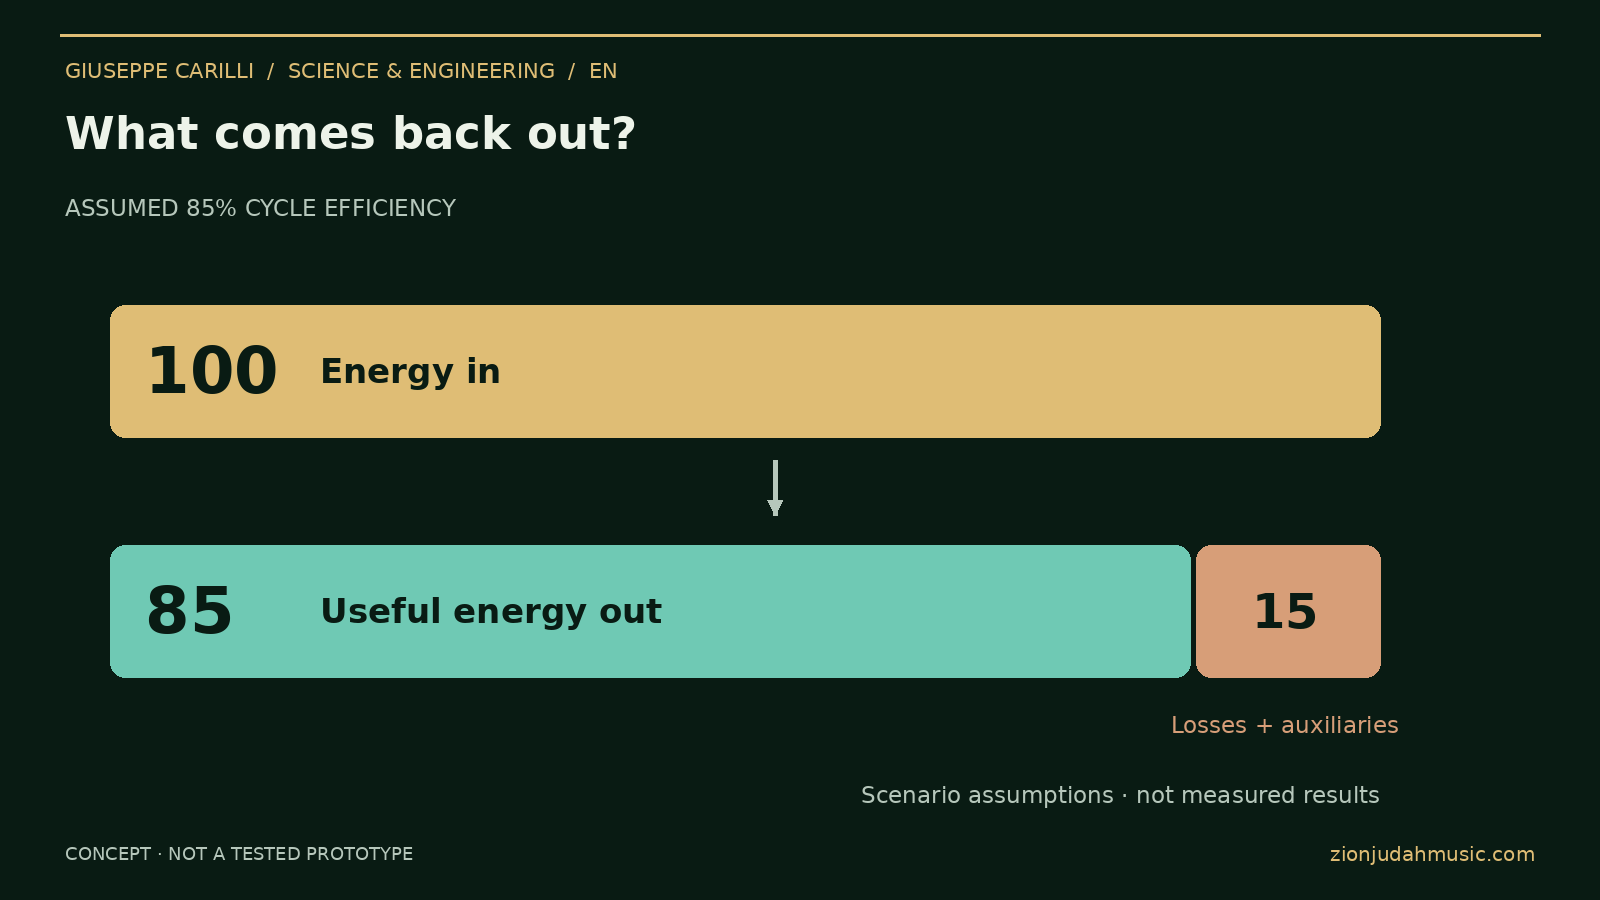
For a complete electrical storage cycle with matched starting and ending internal energy states, Ein = Eout + Eloss. Include charging, waiting, discharge and auxiliaries once. Shaft-to-AC generator efficiency and AC-to-AC storage efficiency measure different boundaries.
4. Ask what the vacuum saves
Vacuum reduces aerodynamic drag, while pumping consumes energy and reduced gas cooling complicates heat removal. Select pressure from measured total cycle losses. Check magnet temperature, demagnetization margin, insulation, rotor stress, magnet retention, balancing, critical speeds, overspeed protection and fragment containment. Copper, core, bearing and converter losses remain.
The useful comparison is the same delivered task in air and vacuum, including pump-down, standby, cooling and all auxiliary demand.
5. Measure before claiming a benefit
Measure shaft torque and speed, active electrical input and output, pressure, temperatures and every auxiliary load on a synchronized time base. Integrate energy across charging, waiting and discharge; state calibration, measurement uncertainty and starting/ending energy states. Publish repeatability, standby losses, lifetime and maintenance evidence.
The video is a conceptual animation, not a working prototype demonstration. The assumed 85% AC-to-AC efficiency and the price scenarios remain hypotheses to validate. A useful result must exceed measurement uncertainty and meet the defined service, mechanical and thermal requirements.
Follow the energy
Can frequent use lower the cost?
There is no demonstrated source of free electricity here. Sunlight can arrive without a fuel bill, but collection, equipment, charging losses and maintenance still cost money. Cleaner operation depends on the charging electricity and the full lifecycle. The cost example is a question to test, not a price promise.
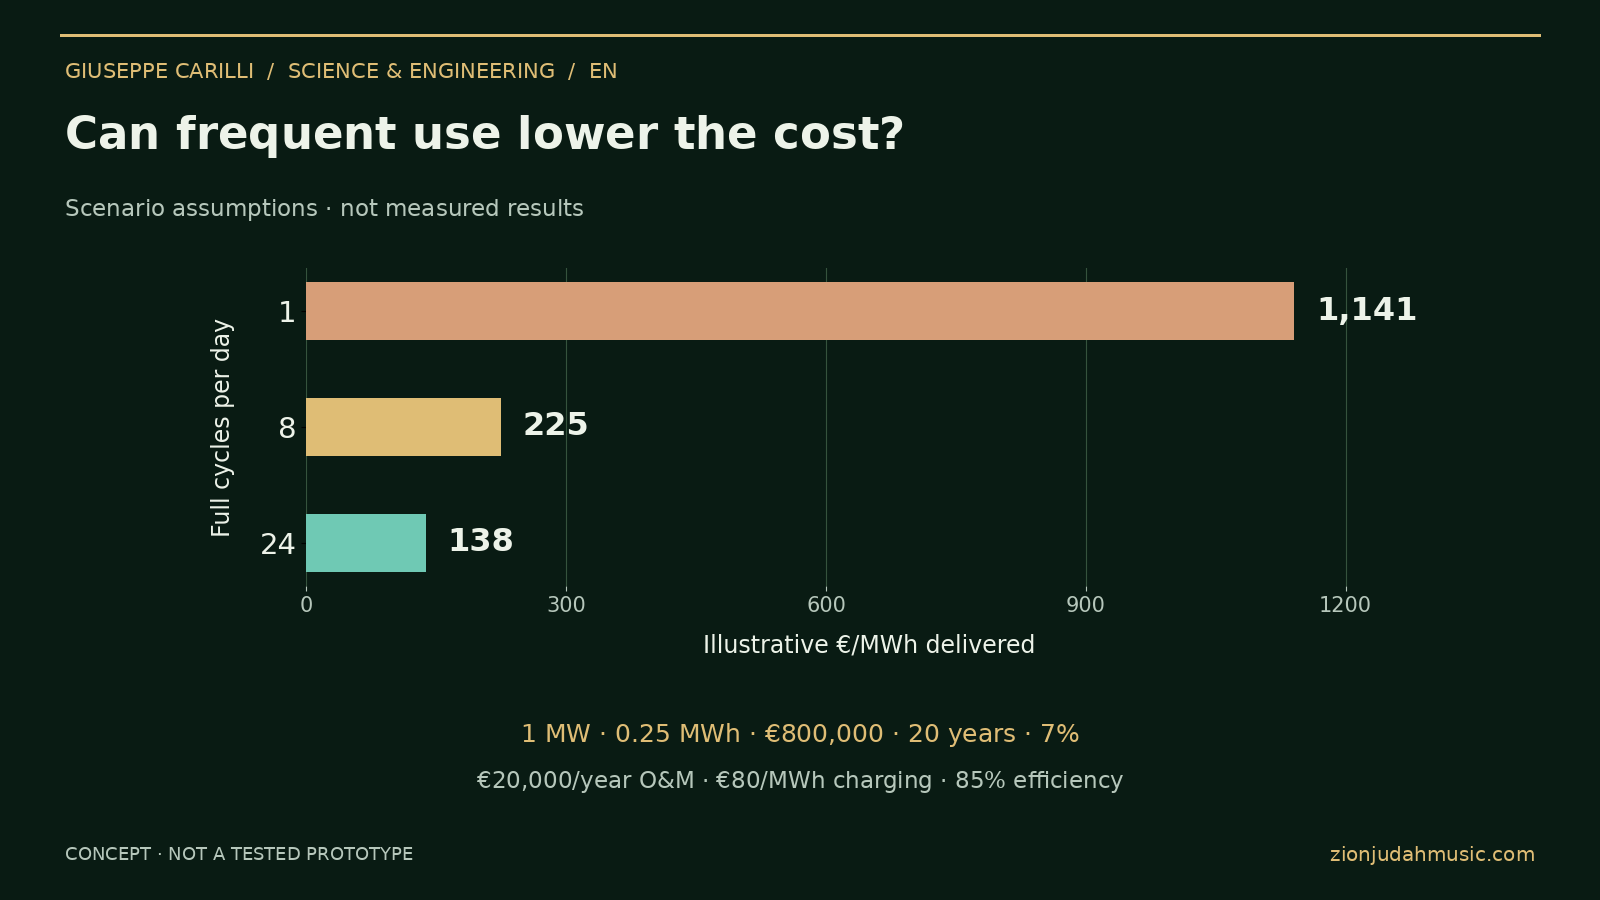
1 MW output; 0.25 MWh delivered per full discharge (15 minutes); €800,000 installed capital; €20,000 annual routine maintenance; 20 years; 7% discount rate; €80/MWh charging-input cost; 85% assumed AC-to-AC cycle efficiency, including auxiliaries for the specified duty. These are modeling assumptions, not measured performance or a supplier offer. [1]
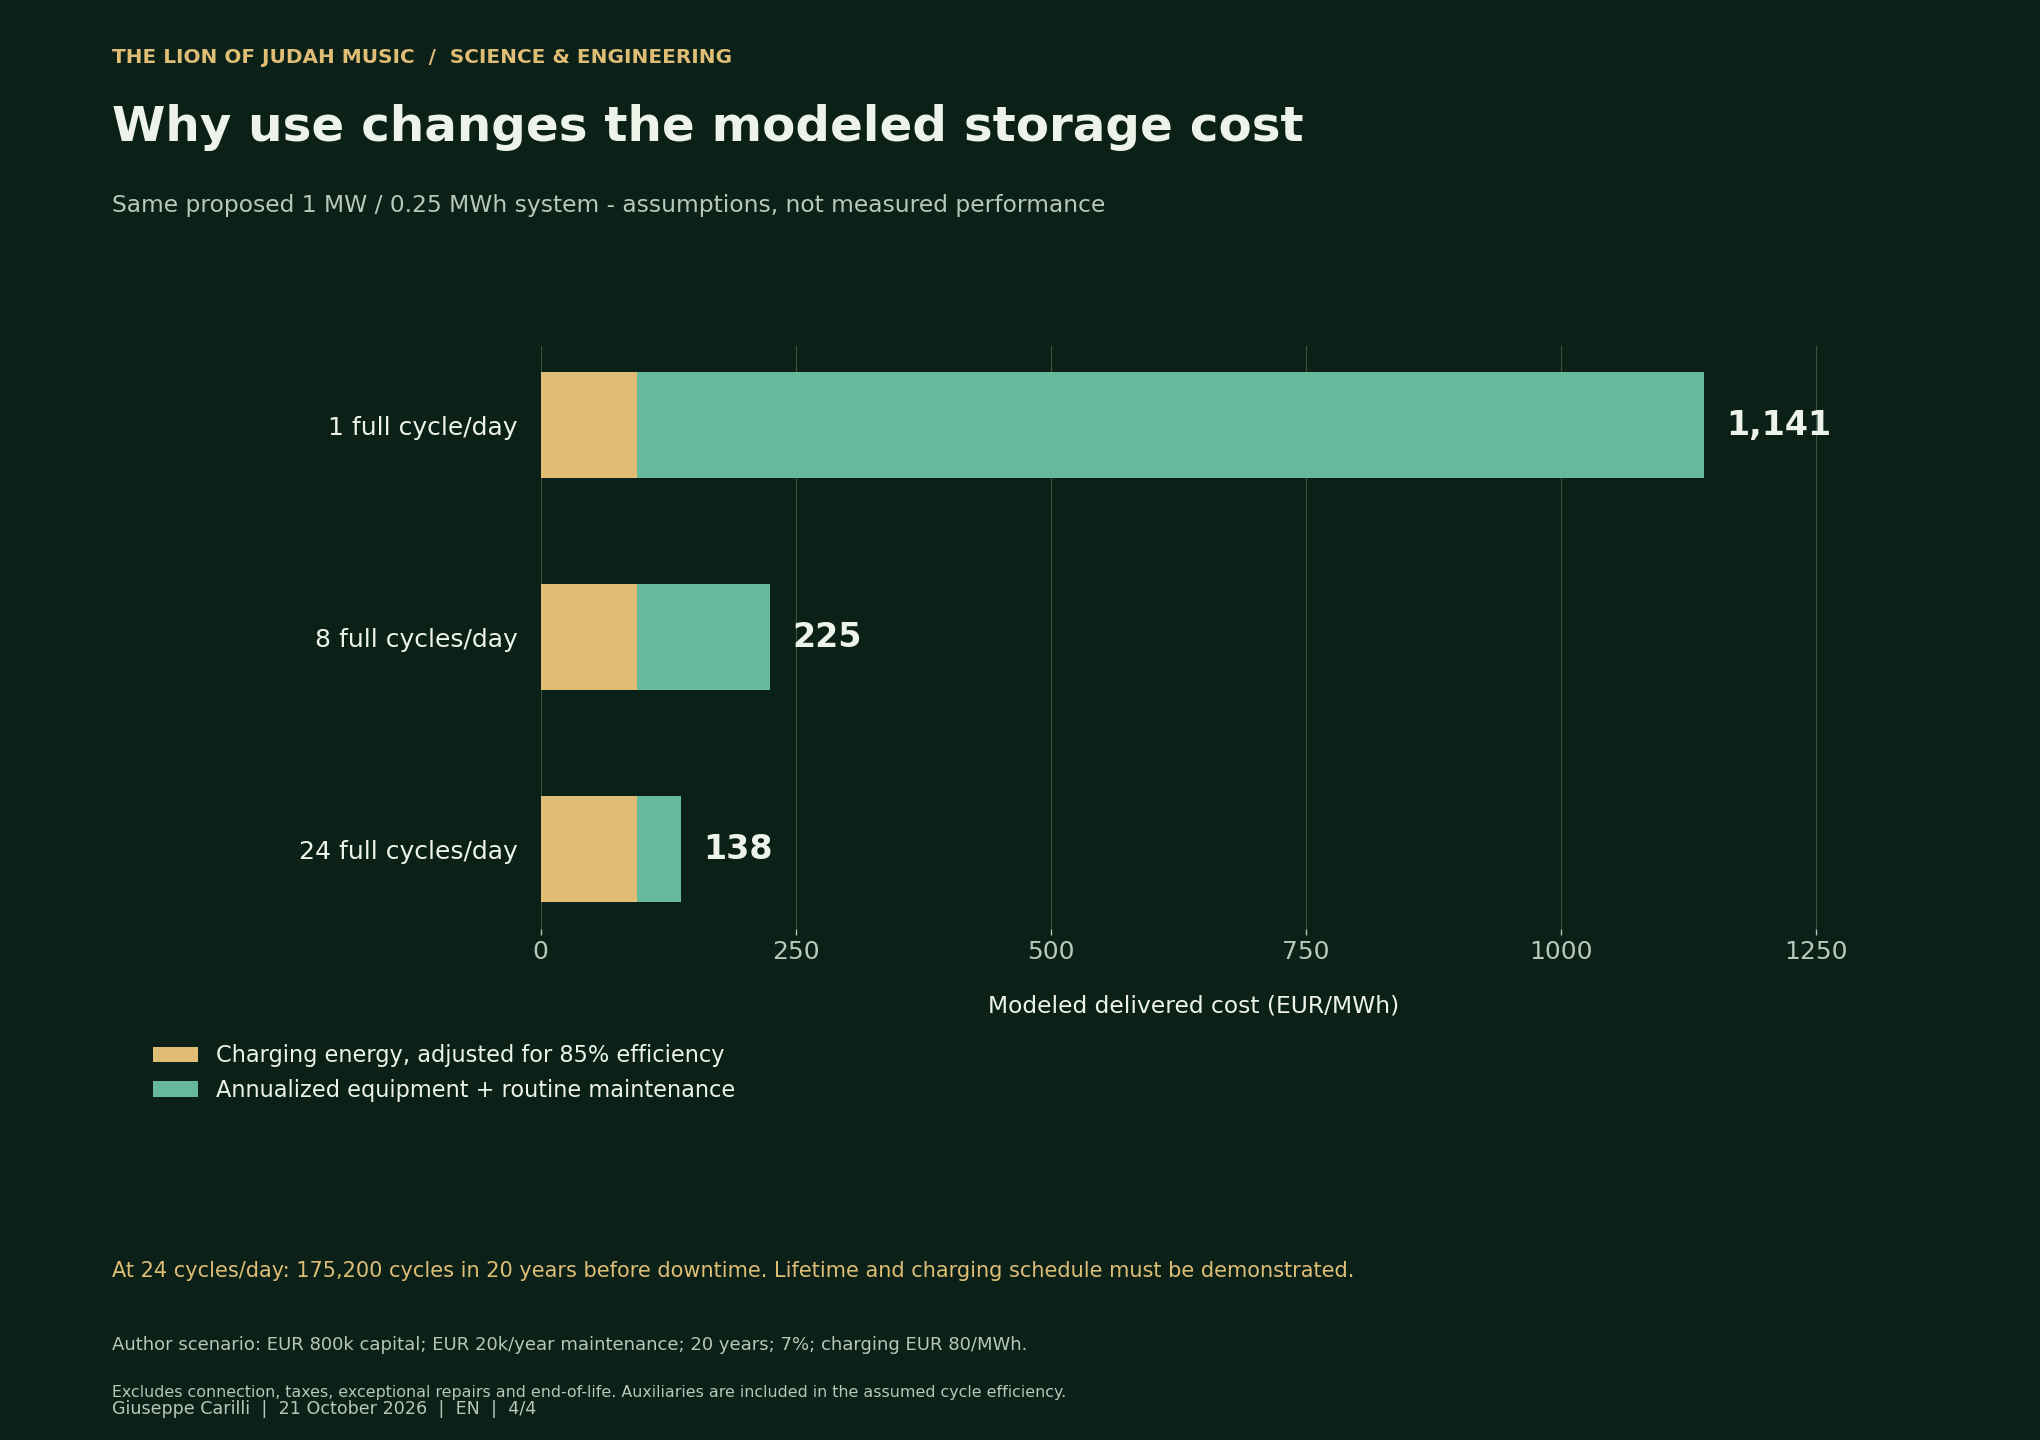
With these assumptions, falling below €150/MWh requires about 18.73 full cycles per day. At 24 cycles per day the model implies 175,200 full cycles over 20 years, before downtime. That duty, lifetime and charging schedule must be demonstrated. Doubling capital to €1.6 million raises the 24-cycle estimate to about €172/MWh. Grid connection, taxes, exceptional repairs and end-of-life costs remain outside this simplified case. Efficiency must be measured again for each waiting-time profile.
Technology and cost comparisons
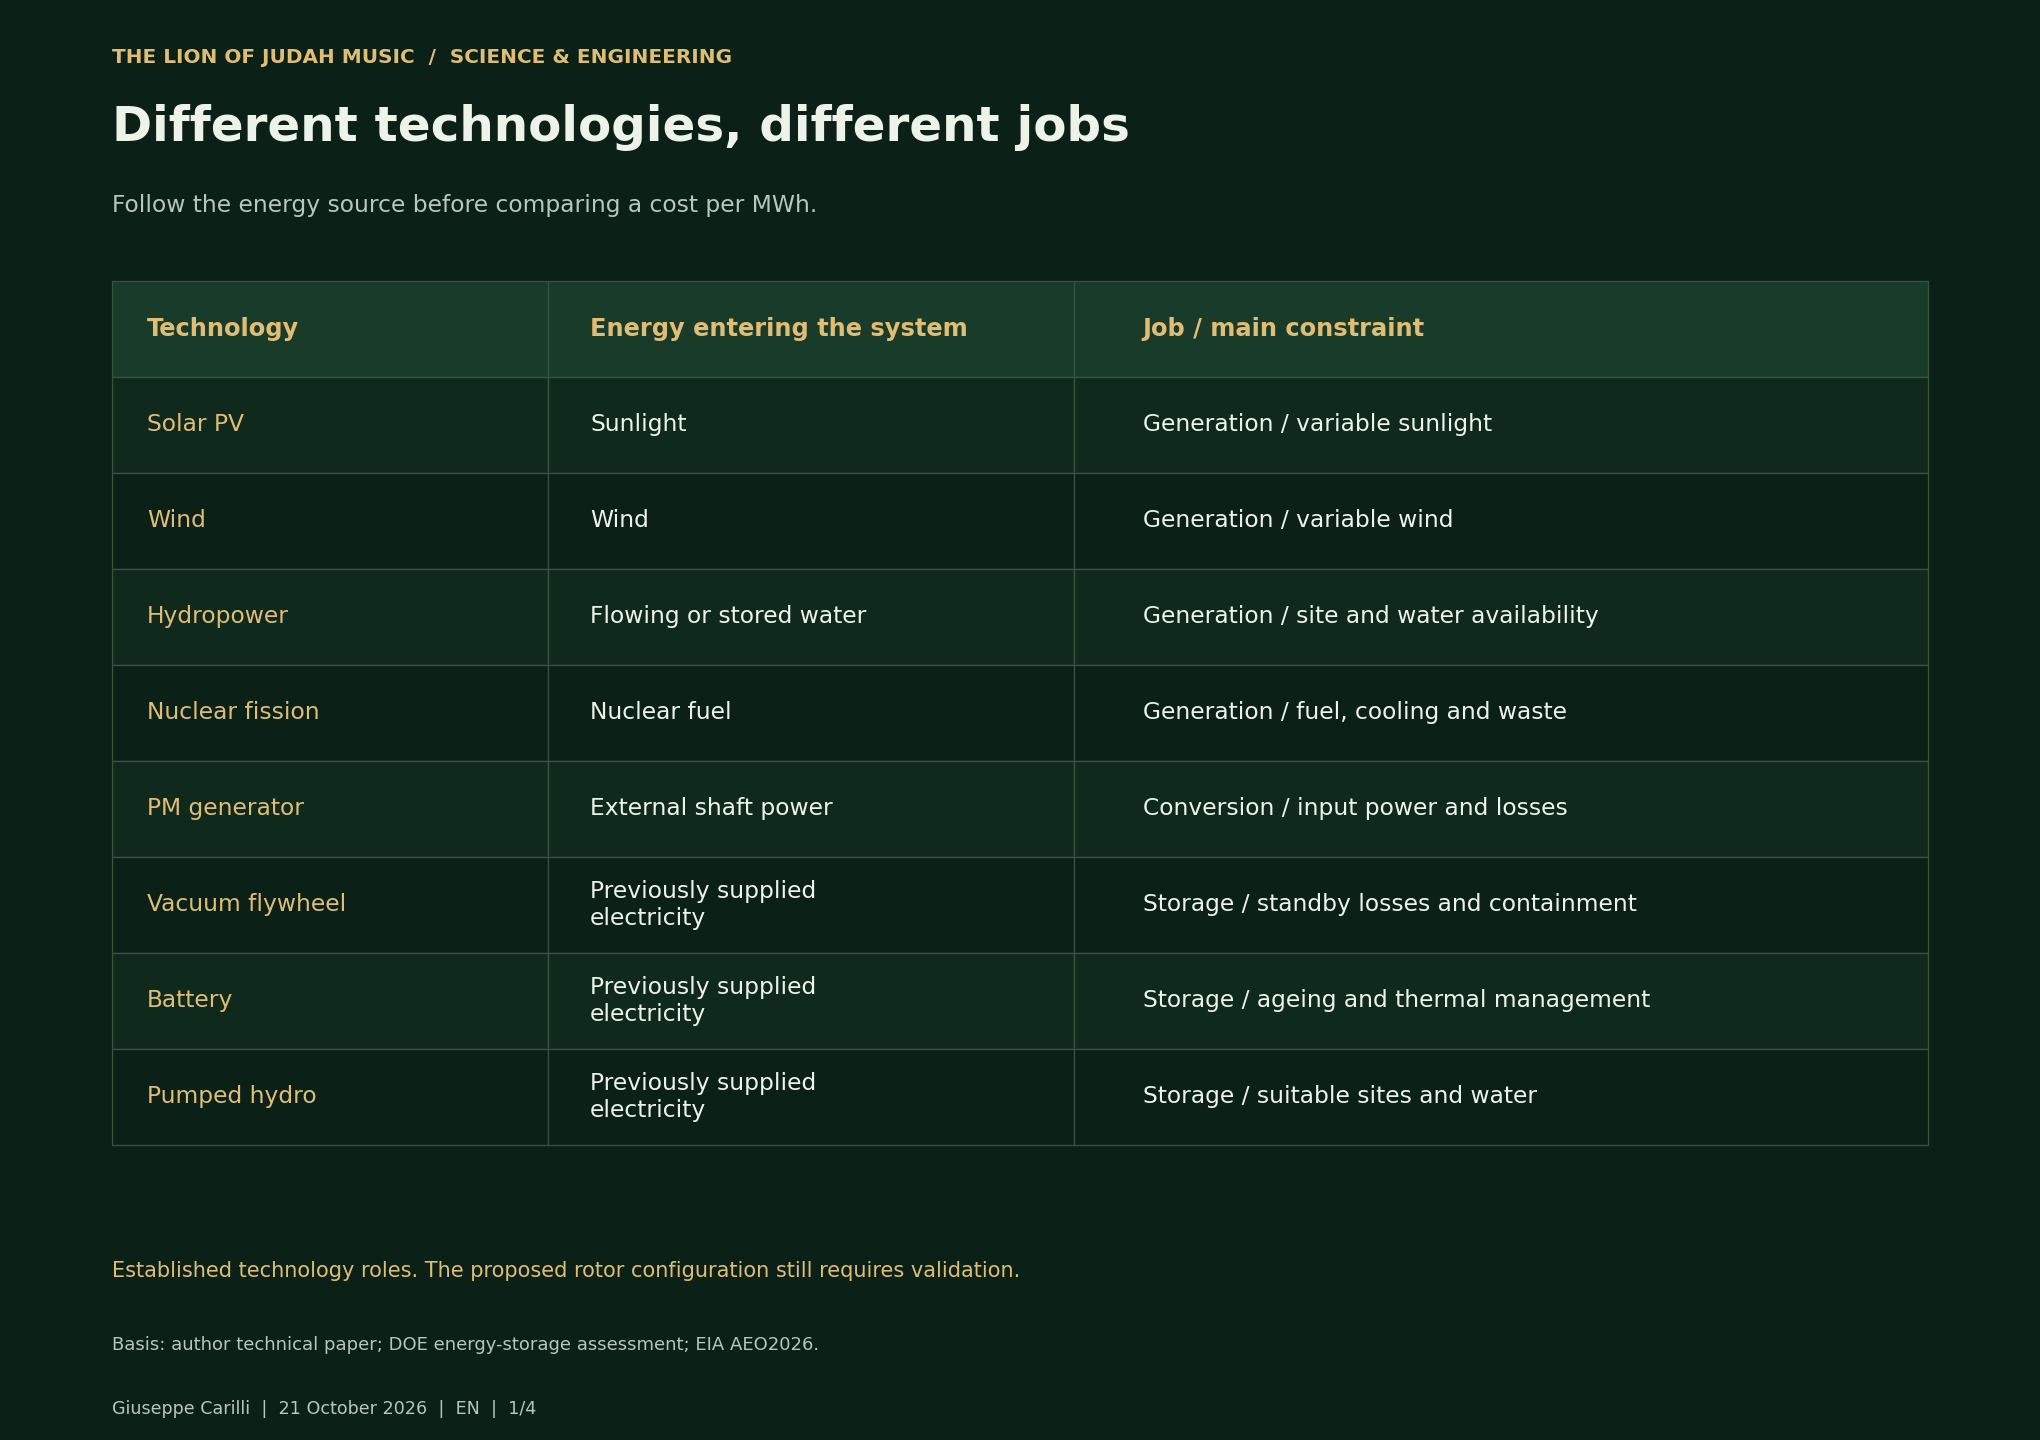
Start with the job each technology does, then read each cost chart in its own setting. Generation LCOE, storage LCOS and our simplified rotor scenario answer different questions.
LCOE estimates lifetime generation cost per unit of electricity. LCOS estimates storage-service cost. Neither is a retail tariff or a complete measure of grid value.
Download all comparison charts - EN / IT / ES / PT Complete article on LinkedIn ↗
Different technologies, different jobs
Accessible data tables
| Technology | Energy entering the system | Job / main constraint |
|---|---|---|
| Solar PV | Sunlight | Generation / variable sunlight |
| Wind | Wind | Generation / variable wind |
| Hydropower | Flowing or stored water | Generation / site and water availability |
| Nuclear fission | Nuclear fuel | Generation / fuel, cooling and waste |
| PM generator | External shaft power | Conversion / input power and losses |
| Vacuum flywheel | Previously supplied electricity | Storage / standby losses and containment |
| Battery | Previously supplied electricity | Storage / ageing and thermal management |
| Pumped hydro | Previously supplied electricity | Storage / suitable sites and water |
Renewable generation costs worldwide
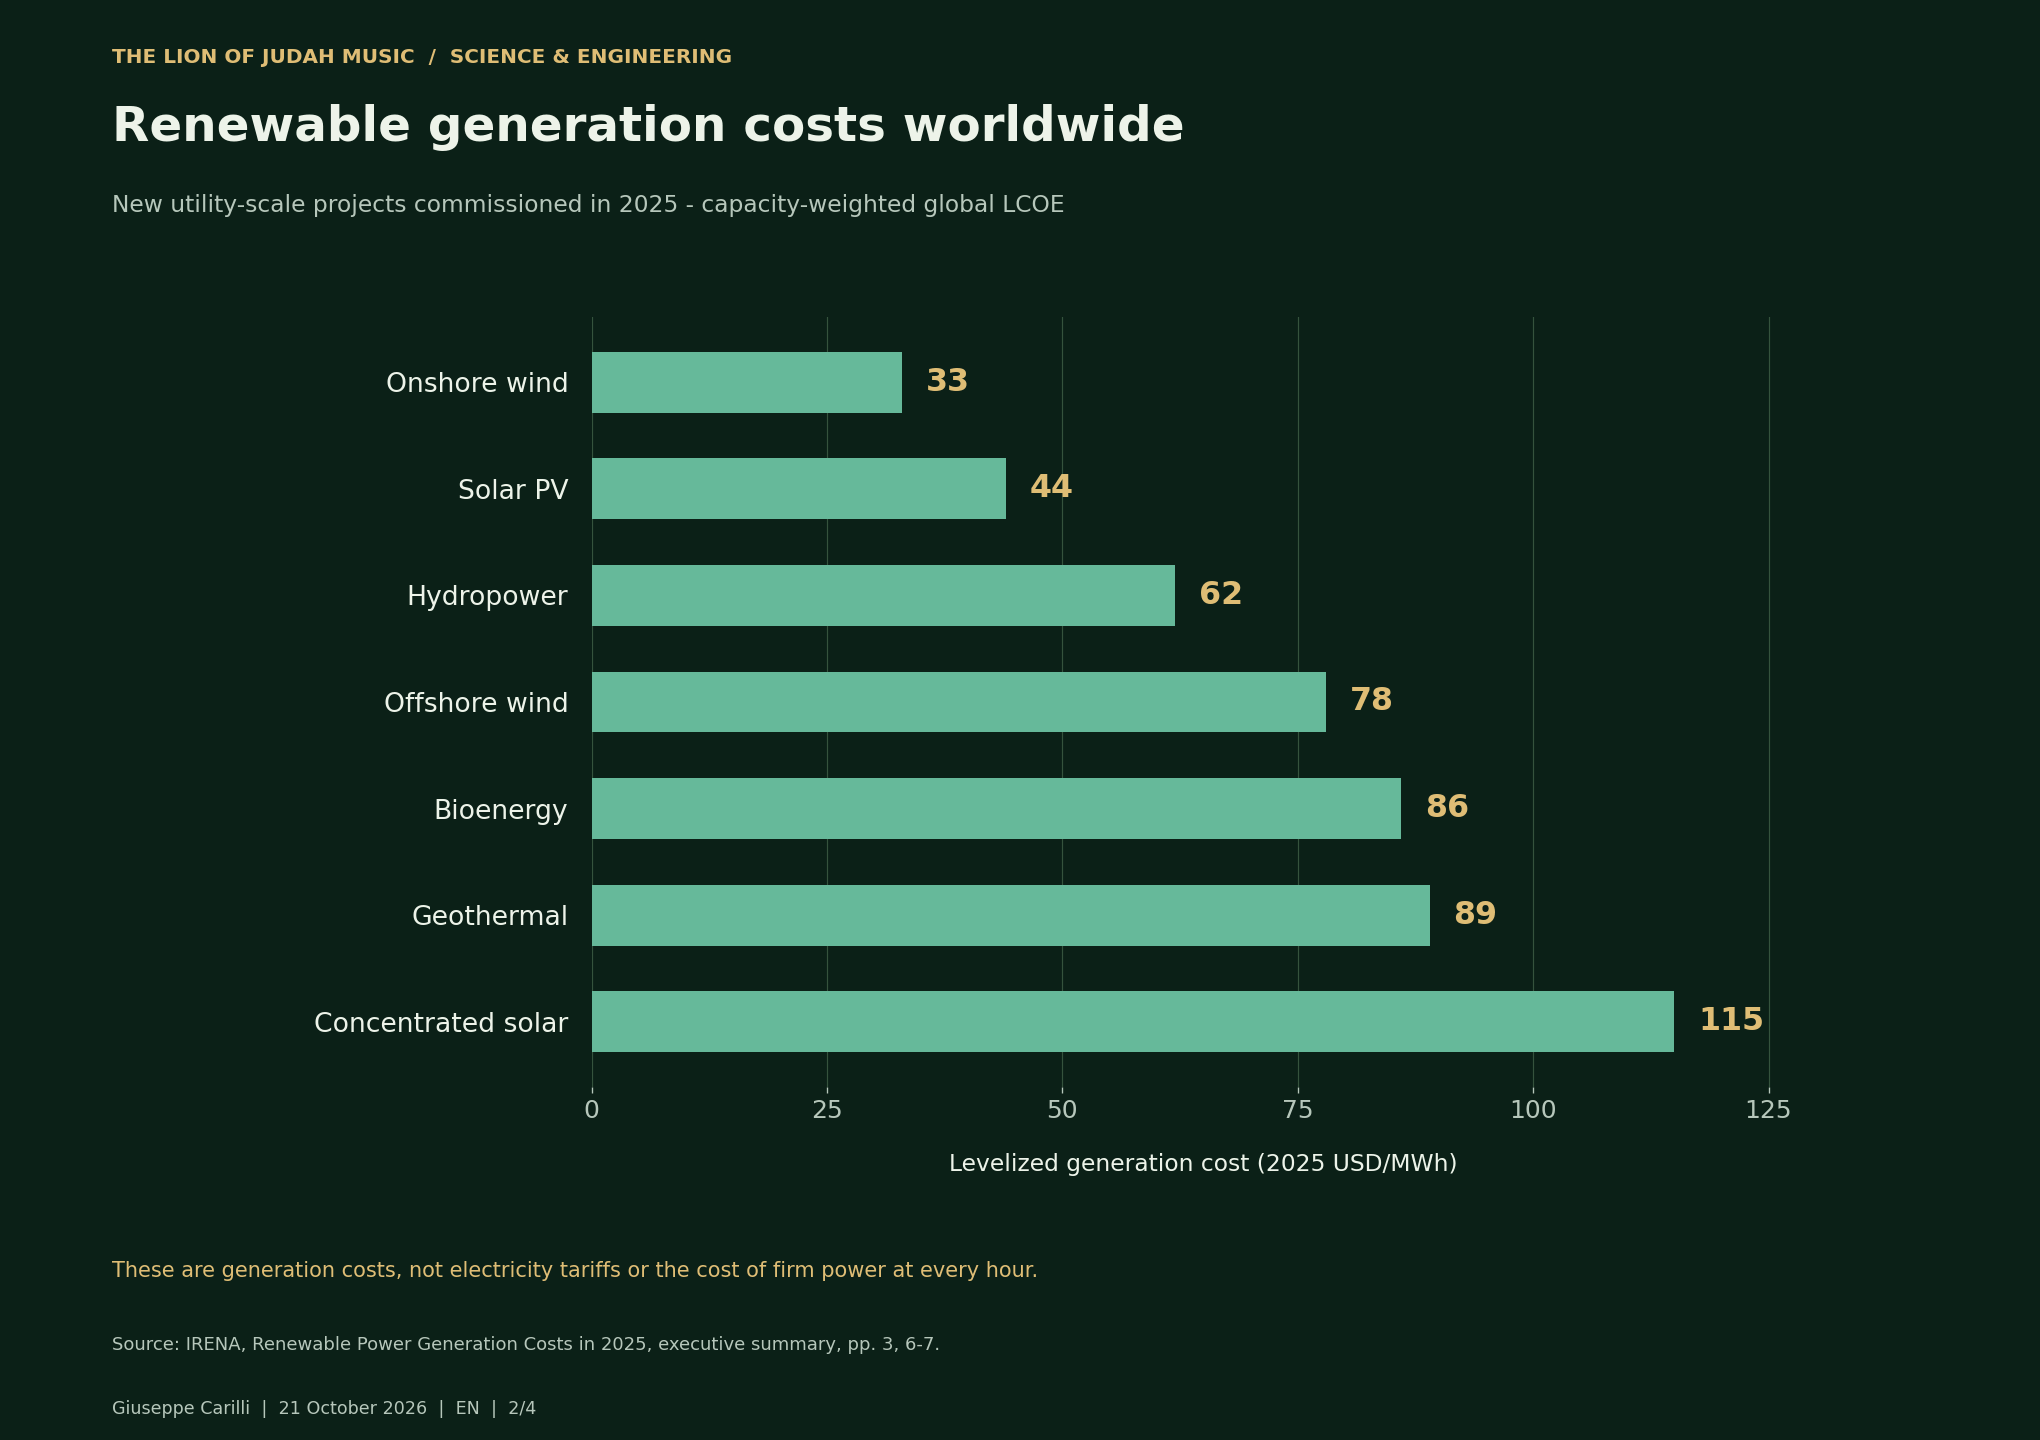
Source: IRENA, Renewable Power Generation Costs in 2025, executive summary, pp. 3, 6-7.
Accessible data tables
| Technology | 2025 USD/MWh |
|---|---|
| Onshore wind | 33 |
| Solar PV | 44 |
| Hydropower | 62 |
| Offshore wind | 78 |
| Bioenergy | 86 |
| Geothermal | 89 |
| Concentrated solar | 115 |
A U.S. generation scenario for 2031
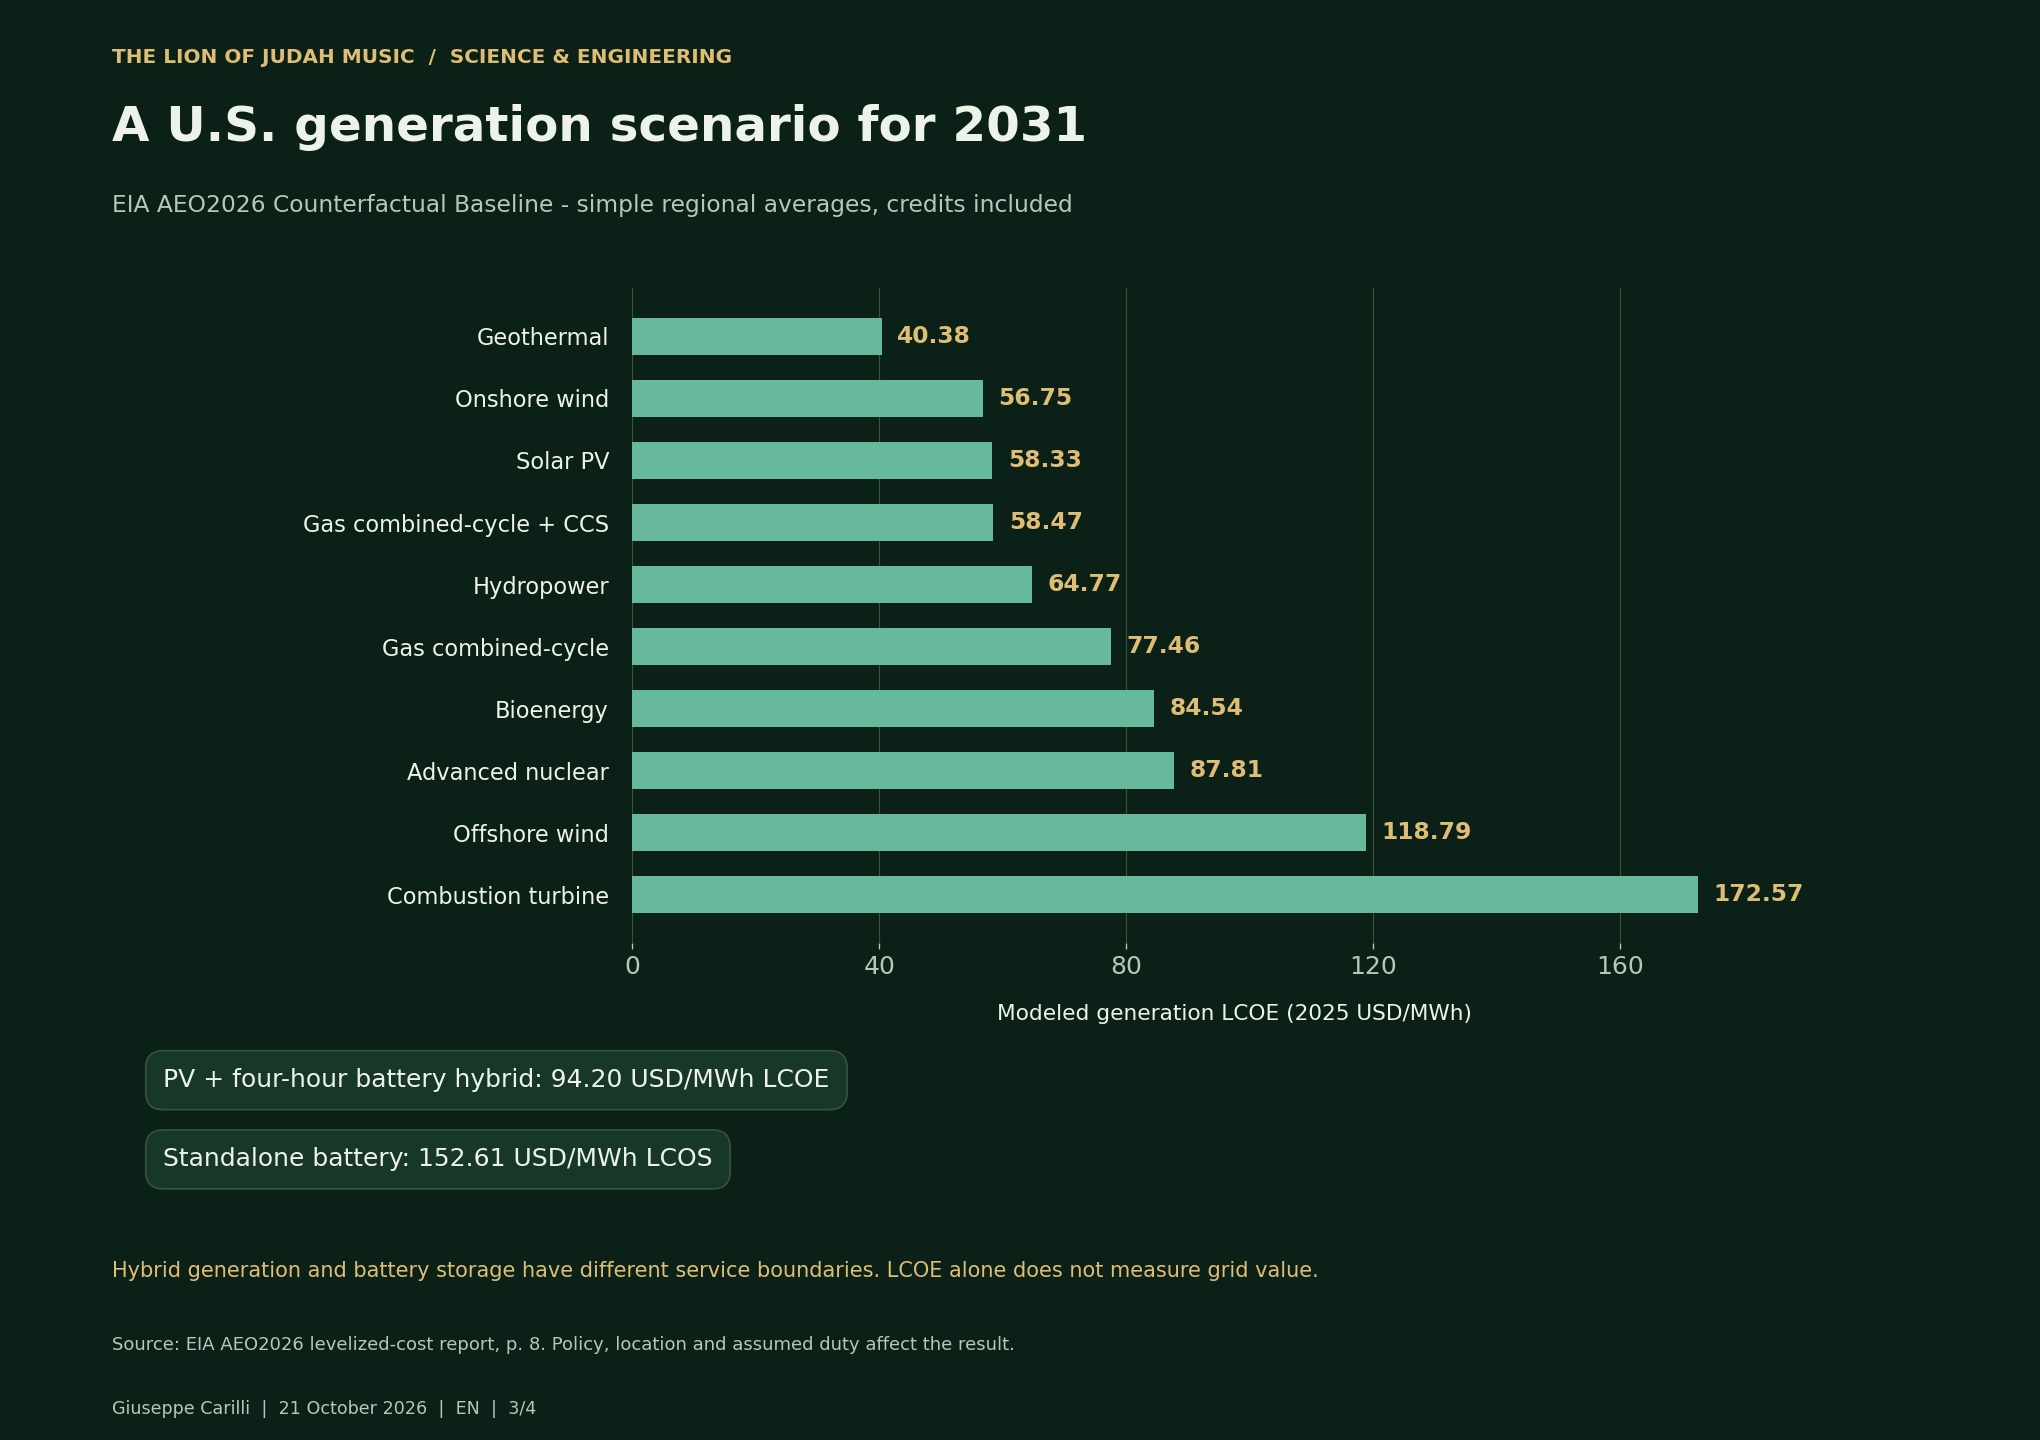
EIA assumes a 30-year cost-recovery period and a 7.27% after-tax weighted average cost of capital for the 2031 online year.
Accessible data tables
| Technology | 2025 USD/MWh |
|---|---|
| Geothermal | 40.38 |
| Onshore wind | 56.75 |
| Solar PV | 58.33 |
| Gas combined-cycle + CCS | 58.47 |
| Hydropower | 64.77 |
| Gas combined-cycle | 77.46 |
| Bioenergy | 84.54 |
| Advanced nuclear | 87.81 |
| Offshore wind | 118.79 |
| Combustion turbine | 172.57 |
| PV + four-hour battery hybrid: 94.20 USD/MWh LCOE | 94.20 LCOE |
| Standalone battery: 152.61 USD/MWh LCOS | 152.61 LCOS |
Why use changes the modeled storage cost
Accessible data tables
| Same proposed 1 MW / 0.25 MWh system - assumptions, not measured performance | EUR/MWh |
|---|---|
| 1 full cycle/day | 1140.85 |
| 8 full cycles/day | 224.96 |
| 24 full cycles/day | 137.73 |
Data and method
The IRENA chart uses global 2025 project averages. The EIA chart is a U.S. projection for 2031 under its stated policy assumptions. The rotor chart recalculates the paper model. No currency conversion or direct ranking between these three datasets is implied.
Sources checked 21 October 2026. CSV
Four useful words
| Word | Meaning |
|---|---|
| Power | How fast energy is delivered, measured in kW or MW. |
| Energy | How much can be delivered, measured in kWh or MWh. |
| Efficiency | The useful output divided by the input over a defined cycle. |
| Lifecycle cost | Equipment, charging, maintenance and other costs over the useful life. |
A useful result would be repeatable net savings compared with the same task in air, larger than measurement uncertainty, with acceptable temperatures, mechanical containment and total cost. Independent measurements are the next step.
I welcome critical review from researchers, engineers, students and anyone interested in resilient energy. The contribution I want to make is practical: a transparent hypothesis, reproducible measurements and a decision that others can check. Shared knowledge and care for Mother Earth belong together.
Read the engineering appendix
Open the engineering appendix for materials, equations, cost calculations and the measurement protocol. The short explanation above and the appendix describe the same proposed system.
Inside the machine
The reference design places permanent magnets on the rotor and copper windings on a stationary stator. A rectifier, DC link and inverter adapt the electrical output to the load. Vacuum can reduce aerodynamic drag, but it complicates heat removal, sealing and service access. The optimum pressure is the one that improves the whole system, rather than simply the lowest achievable pressure. [1], [3]
| Element | Engineering choice | Evidence to obtain |
|---|---|---|
| Magnets | NdFeB; consider SmCo or ferrite where appropriate. | Temperature, demagnetization margin and supply traceability. |
| Windings + core | Copper and insulated electrical-steel laminations. | Hot resistance, insulation and waveform-dependent core loss. |
| Rotor + enclosure | Qualified retention, balancing and fragment containment. | Stress, critical speeds, fatigue and fault response. |
| Bearings + vacuum | Bearings, seals, pump and emergency touchdown support as required. | Standby power, leakage and loss-of-control behavior. |
| Cooling + converters | Defined thermal paths and protected power electronics. | Hot-spot temperatures, conversion losses and usable AC output. |
A small example makes the scale visible
An ideal thin ring of 10 kg and radius 0.20 m has J = 0.40 kg·m². At 3,000 rpm it contains about 5.48 Wh, equivalent to 19.7 seconds at 1 kW only if all its kinetic energy could be recovered without losses. A real machine retains a minimum operating speed, so less energy is available. This example is unrelated to the grid-scale cost scenario on the next page. [1; recalculated here]
Eusable = ½ J(ωmax² − ωmin²)
J is rotational inertia; ω is angular speed in rad/s. Delivered electrical energy is lower after conversion, standby and auxiliary losses.
Power (kW or MW) describes the delivery rate. Energy (kWh or MWh) describes the amount available. A high power rating alone does not establish a long discharge duration.
The cost of using it
A storage project must pay for the energy it receives and for the equipment that returns it. Compare alternatives at the same power, useful duration, response requirement, waiting time and annual duty. DOE's storage-cost methodology includes charging and replacement costs. Its assessment provides a framework, not a quotation or a validation of this machine. [4]
Illustrative scenario from the paper
1 MW output; 0.25 MWh delivered per full discharge (15 minutes); €800,000 installed capital; €20,000 annual routine maintenance; 20 years; 7% discount rate; €80/MWh charging-input cost; 85% assumed AC-to-AC cycle efficiency, including auxiliaries for the specified duty. These are modeling assumptions, not measured performance or a supplier offer. [1]
| Full cycles/day | Delivered MWh/year | Modeled €/MWh |
|---|---|---|
| 1 | 91.25 | 1,141 |
| 8 | 730 | 225 |
| 24 | 2,190 | 138 |
Calculated with unrounded values: capital recovery factor 0.0943929; annual fixed cost €95,514.34. Q = 0.25 × 365 × c. Indicative unit cost = €95,514.34 / Q + €80 / 0.85.
With these assumptions, falling below €150/MWh requires about 18.73 full cycles per day. At 24 cycles per day the model implies 175,200 full cycles over 20 years, before downtime. That duty, lifetime and charging schedule must be demonstrated. Doubling capital to €1.6 million raises the 24-cycle estimate to about €172/MWh. Grid connection, taxes, exceptional repairs and end-of-life costs remain outside this simplified case. Efficiency must be measured again for each waiting-time profile.
Use market comparisons carefully
IRENA reports global weighted-average generation costs for new 2025 projects of USD 33/MWh for onshore wind and USD 44/MWh for solar PV, in 2025 dollars. These describe generation, not the delivered cost of this storage system. EIA's AEO2026 estimates concern US resources entering service in 2031 under stated policy and financing assumptions. Neither is a local tariff, a guaranteed price or a single ranking of interchangeable services. [5], [6]
What would count as evidence?
A credible next step is a contained laboratory demonstrator, evaluated by qualified engineers before a field pilot. Define the service and the pass/fail criteria before seeing the results. The supplied paper presents a design assessment and scenarios; it does not supply independent prototype measurements proving net savings or commercial viability. [1]
- Define the boundary
Record every external electrical and mechanical input, useful output and auxiliary load. Include batteries, the DC bus and initial rotor energy.
- Measure synchronized data
Log active power, shaft torque, speed, pressure and temperature together. State calibration, sampling, integration method and uncertainty.
- Compare air and vacuum
Use matched load and speed trajectories. Measure pump-down and standby demand, and compare a conventional machine on the same useful task.
- Close the cycle
Start and end at matched speed and other stored-energy states, or correct explicitly for their changes. Integrate energy over charging, waiting and discharge.
- Publish a decision
Require a repeatable net benefit larger than measurement uncertainty, acceptable temperatures and containment, and a competitive lifecycle cost for the defined service.
For an electrical-only storage cycle at matched internal states: E_in = E_out + E_losses, with auxiliaries counted once. Report both AC-to-AC cycle efficiency and standby loss. Generator shaft-to-AC efficiency is a different boundary and must be identified separately.
From an Italian test bench to a worldwide discussion
A pilot near a variable industrial load or solar plant can make the service measurable. PVGIS can support solar-resource assessment where relevant; measured load data and local network requirements complete the picture. Grid connection and market access need current, jurisdiction-specific approval. [7]
Environmental comparison should include manufacturing, magnet sourcing, lifetime, repairs, containment and the electricity used for charging and auxiliaries. A flywheel has mechanical failure risks and ongoing losses. Batteries, supercapacitors and other storage options should be compared on the same service. More renewable generation and effective storage perform complementary roles.
I welcome critical review from researchers, engineers, students and anyone interested in resilient energy. The contribution I want to make is practical: a transparent hypothesis, reproducible measurements and a decision that others can check. Shared knowledge and care for Mother Earth belong together.
Sources, methods and edition notes
Selected primary sources supporting this article. The original paper contains a broader 25-item bibliography. Links were checked on 21 October 2026. External sources describe established principles or other projects; they do not endorse this proposed machine.
- Giuseppe Carilli · Electromagnetic machine with a vacuum enclosed rotorAuthor-supplied technical paper · 22 pages · IT / EN / ES
- U.S. Department of Energy · Grid-Scale Flywheel Energy Storage PlantProject fact sheet · October 2012
- NASA · 7.0 Thermal ControlSmall Spacecraft Technology State of the Art · 2026
- U.S. Department of Energy · 2022 Grid Energy Storage Technology Cost and Performance AssessmentStorage methodology and lifecycle cost boundaries · 2022
- IRENA · Renewable Power Generation Costs in 2025: Executive Summary2026 · 2025 USD · pp. 6-7
- U.S. Energy Information Administration · Levelized Costs of New Generation Resources in AEO2026April 2026 · 2031 online year · pp. 2-3, 6 and 8
- European Commission, Joint Research Centre · Photovoltaic Geographical Information System (PVGIS)Site-specific solar-resource tools
What this edition clarifies
- Adds the usable-energy relation between maximum and minimum speed, and separates the small-ring example from the hypothetical 1 MW scenario.
- Recomputes the financial example, identifies excluded costs and makes the high-cycle lifetime requirement explicit.
- Separates documented technology, design choices, assumed economics and evidence still required. It does not claim a new physical principle, a validated prototype, peer review or commercial readiness.
Equations and scenario results were recalculated from the paper's stated inputs. No experimental dataset was supplied or generated for this edition. This is an editorial companion article, not a replacement for the original technical paper.
Consolidated from the introductory, technical-video and comparison-chart posts. Conceptual design; independent prototype performance and commercial cost remain to be demonstrated.
Giuseppe Carilli · The Lion of Judah Music
Energy · Shared knowledge · Respect for Mother Earth
LinkedIn · Science & Engineering